The Process of Exploration
The giant high grade Charters Towers style mineralisation and ore bodies are rare in the world. Citigold Corporation has produced gold at Charters Towers as part of test mining of various mining methods. The current major gold mining infrastructure is to be expanded and re-activated on this major high-grade goldfield.
Citigold is a successful exploration corporation having defined the Inferred Mineral Resources of 11 million ounces of gold (25 million tonnes @14 g/t Au).
Achieving the greatest results in realising Citigold’s exploration potential requires a team of technical experts including geologists, geophysicists, geochemists, surveyors, field hands, and drillers as well as contractors and consultants who apply their skill base at various stages of the project.
Our aim is to further unlock the vast exploration potential of the high grade Charters Towers goldfield. Stand alone gold deposits over 5 million ounces with a grade of 10 g/t or more are rare. The Charters Towers field is such a deposit.
Identifying the main prospect areas with the best potential for new gold and mineralisation requires a solid understanding of the formation of Charters Towers gold deposits, the geology, past production and the application of sophisticated geophysics. The identification process involves extensive geological mapping, geochemical sampling, geophysical surveys, assaying of rock-chip samples, and drilling to enable calculations to be made on the nature, size, geological continuity and shape of potential ore bodies.
Compilation of the various data then enables final resource estimations to be analysed which determines the final delineation of mineral deposits. Evaluation of the economic and financial costs involved in the project then follows and ultimately leads to the final development stage of the gold mine. This work and planning has already been done at Charters Towers.
Deep Hole Drilling
The current mineral resource has only been defined down to a depth of 1,200 metres. Of the 1,559 significant drill intersections used in the 2005 Inferred Mineral Resource estimate, there are 22 drill intersections deeper than 1,000 metres, of which 19 are deeper than 1,100 metres and 10 deeper than 1,200 metres, with a maximum gold grade of 20.54 g/t Au. The deepest intersection in 2005 was 1,300.1 metres which returned 2.3 metre-grams per tonne.
In 2008, a 2,000 metre deep hole was drilled. This hole produced the following:
- Gold mineralisation a further extended 700 metres vertically to 1,900 metres.
- Continuity of mineralisation confirmed.
- Potential to significantly increase total gold resource.
- Geological model of deep gold structures proven.
- Record depth for Atlas Copco Diamac U8 APC drill.
This is believed at that time to be a world record depth hole drilled with the Atlas Copco U8 APC diamond core drill and the deepest diamond drill hole in northeast Queensland. The 2 kilometres of BQ drill rods in the ground weighed nearly 13 tonnes with this powerful 'mighty midget' drill rig completed the hole and pulled the rods successfully.
The final piece of drill core retrieved by the rig was from 2001.1 metres. The hole was drilled at a steep angle from surface of 78 degrees and stayed remarkably straight.
Citigold Corporation’s, now Chairman, Mr Mark Lynch said at the time “The results from the deep hole are awesome and prove beyond doubt that the Charters Towers mineralised system extends to great depths, way beyond the limits previously mined and remains open at depth and to the east”
The hole intersected additional separate mineralised structures of 0.50 metres length at 1,615 and 1,778 metres plus a smaller 0.02 metres at 1,982 metre depth. The results confirm the presence of gold related alteration and mineralisation and demonstrate that the mineralised structures persist to at least 1,900 m depth on the eastern side of the gold field.
Citigold’s exploration strategy is focused around and adjacent to its mining operations at Charters Towers. This is referred to as “brownfields” exploration, exploring in and around known mineralised areas, rather than exploring “greenfields” or unknown areas.
The Geological Model – Tech Talk
Summary:
Mineralisation Style:
The mineralisation is contained in sheeted quartz reefs (also called veins or lodes) in fissures in granite and granodiorite rock.
| DIMENSIONS: | The reefs are typically 0.3 to 1.5 m thick but can, in rare cases, be up to 6 to15 metres thick. The average thickness is less than 0.9 metres. The main Central gold field is 5 kilometres long, with individual reefs up to two kilometres long, and up to 1600 metres down-dip. The reefs have been drilled to a maximum vertical depth of 2,000 metres. The old workings extracted gold down to 1,000 metres vertical depth, with most workings above 600 metres depth. |
| ORIENTATION: | The reefs dip at 23 to 50 degrees. The longer reefs strike eastwest and dip to the north, and a set of shorter but higher-grade veins strike NNW-SSE and dip to the northeast. |
| TEMPERATURE OF FORMATION: | The reefs formed at a medium temperature (mesothermal veins) ranging from 170° C to 360° C with a preferred value of 310° C. |
| AGE: | The age of the mineralisation is 398 to 415 Million years ago (normally 400 M years), straddling the boundary between the Silurian and Devonian geological ages. |
| GOLD GRAIN SIZE: | The gold is in small particles mostly less than 100 microns which form late in the crystallisation history, occurring mainly along sulphide grain boundaries and along cracks within the sulphide grains. The gold is free milling and not trapped inside sulphide. |
| ASSOCIATED MINERALS: | Associated minerals are sulphides of lead (galena), zinc (sphalerite), copper (chalcopyrite) and iron (pyrite). Total sulphides are about 5% of the ore mined, and the average value of lead and zinc in the processed ore is 7000 to 9000 ppm (0.7% to 0.9%), less than 1%. The lead, zinc and copper values are too low to be an economic by-product. Extractable silver is in a ratio of about 2:1 gold to silver. Other minerals in the reefs are calcite and quartz with minor amounts of clay and crushed and chemically altered granodiorite. |
| GOLD RECOVERY: | The metallurgical recovery by conventional CIL extraction is about 95% to 98%. Ultra modern recovery methods may be able to recover gold down to 5 microns and pontentially up to circa 75% of the gold. |
| SOURCE OF THE GOLD: | The most probable source of the gold mineralisation is granitic fluids that formed late in the crystallisation history of the granitic rocks. The fluids were forced into fissures and faults caused by cooling and contraction by rising of other granitic bodies in the brittle crust and lateral compression of the crust by tectonic movement. |
This is an extract of Section 9 of the 173 page document “Mineral Resources and Reserves 2012", commencing on Page 37. For further information on the goldfield please see the full report.( full report, click HERE)
| 9.1 | The Geological Model
A key part of accurate mineral resource and ore reserve estimation is a clear understanding of the geological model or models of the mineralised body or system – the shape of the mineralised bodies, their orientation and location, the nature, chemistry and origin of the gold-bearing fluids, the fluid pathways, the control mechanisms on metal deposition and the continuity of the mineralised bodies. The model must be robust and proven by testing, as is the case at Charters Towers. This information can be also used to define future exploration targets. |
| 9.2 | Research
Since 1980, there has been extensive there has been extensive research conducted on the Charters Towers and adjacent areas by over 20 government, industry and university researchers and presented in peer-reviewed publications and public domain documents. Recent research since 1997 was based on new drill core, underground openings and open pits not available to previous workers. This research provided sound evidence that mineralisation is reasonably considered by the Company to persist to at least 3,000 metres, although Mineral Resources have been estimated to only 1,200 metres, limited by the deepest drilling at 1,270m. The ore body models defined in the Company’s Inferred Mineral Resources report of May 2005 have since been tested and proven by underground mining on the Warrior ore body, a major east-west striking mineralised structure. Key points on which the Company’s geological models are based are listed below: · Oxygen and hydrogen isotope fractionation data indicate a formation temperature ranging from 170° C to 360° C with a preferred value of 310° C. This temperature range is supported by studies of fluid inclusions, textures and wall-rock alteration mineralogy (Peters & Golding, 1989; Kreuzer 2003, pp. C-1, C-51, D-30). · The low-permeability intrusions of the Ravenswood Batholith restricted and focused the ascending fluids rising from deep in the Earth’s crust. Sudden fault rupturing focused the fluid flow into the active reef structures, precipitating gold and base metals by fluid mixing and subsequent chemical and pressure changes to the fluid (Kreuzer 2003, p.D-56 to 58). · Geological and geophysical data indicate that the Charters Towers mineralisation was not subjected to further significant deformation after the gold mineralisation formed (Kreuzer 2003, p. E-67). · The host structures are characterized by good vertical continuity to at least 1.3 kilometres based on the Company drilling and previous mine workings (Reid 1917), (Kreuzer 2003). · The reefs are located on the margins of gravity lows that coincide with distinct intrusions or complex igneous bodies. (Kreuzer 2003, p. E-67; the Company’s geophysical studies) · Wall rock alteration studies indicate the fluid was slightly acidic to near neutral (pH 5-6) (Kreuzer 2003, pp. C-54, C-59; Corbett & Leach 1995). The oxidizing fluids have produced red hematite alteration, destroying magnetite where it is in contact with the fluids and creating local magnetic lows. This creates a geophysical signature for exploration, of de-magnetised areas adjacent to gravity lows (The Company mapping and aeromagnetic and gravity geophysical surveys). · Studies of quartz reefs from over 200 gold mines in North Queensland indicate the Charters Towers gold-bearing reefs are typical of granitic rather than sub-volcanic hosts (Dowling & Morrison, 1989: Kreuzer 2003 p. C-54). · Structural domain, fabric studies and spatial autocorrelation (Fry analysis – see Glossary) indicate that the east-west and NNW-SSE striking planes of weakness were oriented most favourably for reactivation during deformation, providing important loci for quartz reef formation and ascent of gold-bearing fluids. Areas with a greater density of intersecting structures were more likely to localize gold deposition. There was a single episode of reef formation and gold mineralisation during the fourth deformation event (designated D4). (Kreuzer 2003, p.E-67). · The reefs have not been significantly shifted by fault movements after formation. Fault movements were minor, on a centimetre to metre scale. This is in agreement with earlier research at the time of mining where average fault separations were reported to be in the order of 0.9 to 1.2 m metres (Reid 1917, Kreuzer 2003, p. B-31; the Company’s mapping). · The current exposure of the Ravenswood Batholith is at its roof zone, meaning that there is a high probability that most of the gold-bearing system is intact and has not been significantly eroded (the Company mapping; Hutton & Rienks 1997). · There is a relationship of gold with galena (lead sulphide), where high gold values are accompanied by high lead values (the Company assaying). The presence of galena was used as an indicator of high grade gold by previous miners (Reid 1917). the Company assays for lead to check for the location of ore shoots if gold values in drill samples are unexpectedly low. · The potential for additional gold-bearing reefs to be discovered away from known mineral occurrences is considerable. Fractal analysis of the spatial distribution of the gold deposits suggests the area to the south of Charters Towers may contain undiscovered deposits. Earlier work by The Company prior to 1999 had already targeted the area to the south based on structural analysis and geological mapping. (Kreuzer 2003, p. E-1, E-67 to 68). |
| 9.3 | Testing the Model |
| 9.3.1 | Drilling
The Company has a robust geological model that has been predicted and then tested by diamond-core drilling down to 2000 metres vertical depth. Intersections into known quartz reefs have hit the predicted position within one metre at depths of up to 1,500m downhole. Over 350,000 metres of drilling has been conducted in 3,200 holes on down-dip and strike extensions of known reef systems, with 1,550 significant drill intersections. Previous explorers that drilled, mapped and sampled the area from 1980 until the float of The Company in 1993 include BHP, Homestake, CRA, AOG, Orion, Mt Leyshon Gold Mines and Great Mines. Prior to 1980 drilling was undertaken by Towers Drilling Co (1932), and the Queensland Department of Mines in 1923 and 1969-70. A detailed project evaluation was conducted by Gold Mines of Australia (the precursor of WMC) in 1935, and The Company holds copies of much of their data. |
| 9.3.2 | Open pit and Underground mining
Underground mining in five underground operations since 1994 (the Central Decline, No.2 Cross Reef, Stockholm, Washington and Warrior mines) has also confirmed predicted intersections with previous workings within 0.3m and has intersected geological structures to confirm the accuracy of the model. Old workings have been re-opened and entered on the Brilliant, Victory, Victoria and Washington reefs, and new underground workings driven on extensions of known reef systems at Warrior, Stockholm, Washington and the No.2 Cross Reef. The new workings have been rock-chip sampled, bulk sampled and the reefs mined by on-reef development and longhole open stoping . Open pit mining was conducted on the Washington and Stockholm reef systems in 1998-2000. The Washington reef is a classic Charters Towers style reef. Stockholm was more diffuse, and was a wider zone with some quartz reef stockworks. Old fill was intersected in previously mined stopes at Stockholm, and was sampled in a 1,500 tonne bulk sample. Total gold production from trial mining and processing a small tonnage of tailings was 38,000 ounces of gold from 1998-2000. All ore was processed through the Black Jack processing plant. In 2006, The Company commenced underground production from the Imperial Mine (Warrior and Sons of Freedom reefs) about 5 km southeast of Charters Towers city centre. Access to the Warrior reef was via a one kilometre-long decline (sloping tunnel) from the floor of the Washington open pit. A series of horizontal mining levels were driven in the ore body at initially 10-metre vertical separations and later 15m vertical separations. Total gold production to 30 June 2011 from Warrior was 53,000 ounces (1600 kg) and mining operations and gold production are continuing. Processing plant recoveries have consistently been around 97%.
All of The Company‟s mining has been along strike and down-dip from previously mined workings, confirming the initial assumption, that new extensions of previously-mined ore bodies would be found and mined. This has been proven now on the Stockholm, Washington, No.2 Cross Reef, Sons of Freedom and Warrior reefs. A total of 91,000 ounces (2830 kg, 2.83 tonnes) of gold has been extracted since 1998, confirming initial assumptions, proving metallurgical recovery and trialling various mining methods and Level intervals.
|
| 9.3.3 | Survey Accuracy of Previous Workings
Detailed mine plans of previous mining operations from 1872 to recent times are held by the Company on site, and these have been digitized and modeled in commercial computer programs (SURPAC and MICROMINE), and cross-checked against modern survey data. The majority of previous plans were accessed from originals held by the Queensland Department of Mines and Energy. The old mine plans inspected in the Company's office are all signed off by licensed mining surveyors who updated their survey pickups every one to three months. A paper was presented on Mine Surveying by C.A.S. Andrews, Licensed Surveyor, to the General Meeting of the Queensland Institute of Surveyors in Brisbane in 1905, and summarised in the September and October 1905 issues of the QGMJ. Andrews gives extensive details of surveying methods used in underlies and levels. All measurements were taken by plumb-line, theodolite and steel chain, strained by a spring balance, from shaft collars indexed to surface survey points. Steel pins were inserted in timbers or rock backs, identical to methods used today in Australian mines. Detail is meticulous, even to the point of using two candles, one either side of the plumb-line, to ensure the centre of the line is sighted, rather than the centre of the illuminated portion if the line was lit from one side only. Distances on the chain were read to two decimal places. The theodolite was set up on planks across vertical shafts to ensure it was directly over the plumbed centre-line. Levels were surveyed by theodolite and chain, using a metal tape to pick up drive outlines and other features such as winzes and rises. Measured offsets were not usually taken to the walls along the drives, as these were usually timbered over, so drives and cross-cut outlines were sketched from the centre-line survey, as were stope faces. Survey pin positions were drafted onto the plans. Survey plugs were installed about two feet inside the lease boundaries for cross-checking when the level was broken into from the adjoining mine. Adjacent levels were cross-checked through the winzes and rises. These records indicate a survey closure error of less than 1 in 5000 (i.e. ±200mm in one kilometre) in chainage and, in the bearings, less than one minute of arc per 1,000' of underground survey (i.e. ±292mm offset in one kilometre). Measurements plotted on the previous plans were reported to one decimal of a foot and one minute of arc. These previous mine plans at a scale of one inch to forty feet (1":40' or 1:480) were digitized by The Company, showing detailed workings and stopes down to 928 m vertical depth. Most of the historic workings were driven on reef. Results used from these plans, when checked against recent survey work, have been within acceptable limits, usually within 0.3 metres. Recent shaft-capping programmes by the Queensland Government has located and surveyed a large number of shaft collars, and this data has been used by The Company to further cross-check the computer models of both the workings and the geology against modern survey pickups. The Department of Mines and Energy launched a project in July 1996 to define the scope and cost of repairing abandoned mine shafts in the Central area. There are around 830 identified shafts within the Charters Towers Central limits area that have been catalogued, with 688 shafts ( it is considered that these could be anything from a few metres deep ‘gouger pits’ to major deep shafts) having been located in the field and inspected. The remaining 143 shafts have yet to be located in the field. The possible existence of a further 280 shafts has been identified from old aerial photos and gold mining lease plans. DME has continued its shaft capping program, 567 sites having been investigated and 240 shafts made safe at Charters Towers and other goldfields since 2003. |
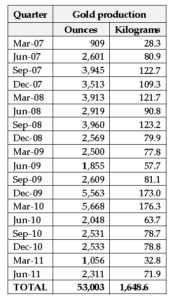 Table 9-1. Gold production from the Imperial Mine
This is an extract of Section 9 of the 173 page document “Mineral Resources and Reserves 2012", commencing on Page 37. For further information on the goldfield please see the full report.( full report, click HERE)
(Updated August 2016)
ASSAY RESULTS
Rock Chips 82 Samples - Stream Sediment Sampling Dec 2020 to Feb 2021 please click here
Sand sediment 2mm 82 samples - Stream sediment sampling Dec 2020 to Feb 2021 please click here
Steam Sediment 84 Samples Locations & BCL Au Dec 2020 to Feb 2021 please click here
Diamond drill core sample assays for the period ending 31 December 2011 please click here
Diamond drill core sample assays for the period ending 31 December 2010 please click here
Diamond drill core sample assays for the financial year ending 30 June 2010 please click here
Diamond drill core sample assays for the Quarter ending 30 March 2009 please click here
Diamond drill core sample assays for the Quarter ending 31 December 2008 please click here
Diamond drill core sample assays for the Quarter ending 30 September 2008 please click here
Diamond drill core sample assays up until the release of the June 2008 Quarterly, please click here
Diamond drill core sample assays for the Quarter ending 31 December 2007 please click here
Diamond drill core sample assays for the period ending 19 December 2007 please click here
NQ Diamond drill core sample assays for the Quarter ending 30 June 2007 please click here
Rock Chip Assays for the Quarter ending 31 March 2007 please click here
Warrior Face sampling on the 830 Crosscut and 840 Levels release 21 March 2007 please click here
NQ Diamond drill core sample assays for the Quarter beginning 1 January 2007 please click here
Rock Chip Assays for the Quarter ending 31 March 2006 please click here
Rock Chip Assays for the Quarter ending 31 December 2005 please click here
Rock Chip Assays for the Quarter ending 30 June 2005 please click here
Quarterly Rock Chip Assays - Quarter ending 31/3/2005 please click here
Quarterly Rock Chip Assays - Quarter ending 31/12/2004 please click here
Quarterly Soil Assays - Quarter ending 31/12/2004 please click here
Standard Abbreviation Codes please click here